 |
|
10.7. openMosixanalyzer
10.7.1. the load-overview
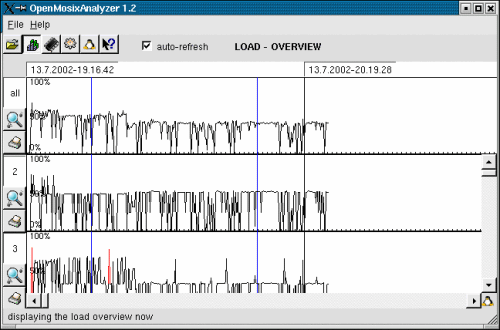
This picture shows the graphical Load-overview in the openMosixanalyzer (Click to enlarge)

With the openMosixanalyzer you can have a non-stop openMosix-history of your cluster. The history log-files created by openMosixcollector are displayed in a graphically way so that you have a long-time overview what happened and happens on your cluster. The openMosixanalyzer can analyze the current "online" logfiles but you can also open older backups of your openMosixcollector history logs by the filemenu. The logfiles are placed in /tmp/openmosixcollector/* (the backups in /tmp/openmosixcollector[date]/*) and you have to open only the main history file "cluster" to take a look at older load-informations. (the [date] in the backup directories for the log-files is the date the history is saved) The start time is displayed on the top and you have a full-day view in the openMosixanalyzer (12 h).
If you are using the openMosixanalyzer for looking at "online"-logfiles (current history) you can enable the "refresh"-checkbox and the view will auto-refresh.
The load-lines are normally black. If the load increases to >75 the lines are drawn red. These values are openMosix--informations. The openMosixanalyzer gets these informations from the files /proc/hpc/nodes/[openMosix ID]/*
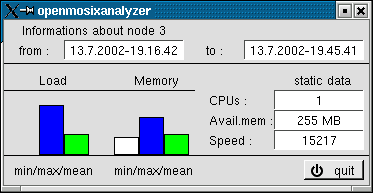
The Find-out-button of each nodes calculates several useful statistic values. Clicking it will open a small new window in which you get the average load- and mem values and some more statically and dynamic informations about the specific node or the whole cluster.
10.7.2. statistical informations about a cluster-node

If there are checkpoints written to the load-history by the openMosixcollector they are displayed as a vertical blue line. You now can compare the load values at a certain moment much easier.
10.7.3. the memory-overview

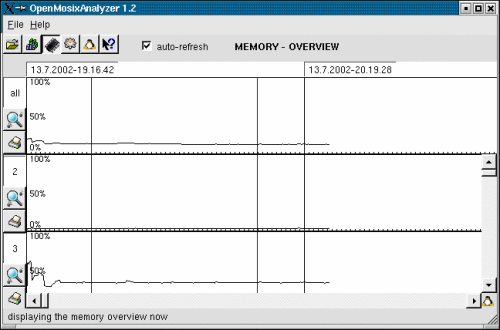
This picture shows the graphical Memory-overview in the openMosixanalyzer
With Memory-overview in the openMosixanalyzer you can have a non-stop memory history similar to the Load-overview. The history log-files created by openMosixcollector are displayed in a graphically way so that you have a long-time overview what happened and happens on your cluster. It analyze the current "online" logfiles but you can also open older backups of your openMosixcollector history logs by the filemenu.
The displayed values are openMosix-informations. The openMosixanalyzer gets these informations from the files
/proc/hpc/nodes/[openMosix-ID]/mem. /proc/hpc/nodes/[openMosix-ID]/rmem. /proc/hpc/nodes/[openMosix-ID]/tmem. |
If there are checkpoints written to the memory-history by the openMosixcollector they are displayed as a vertical blue line.
10.7.4. openMosixhistory

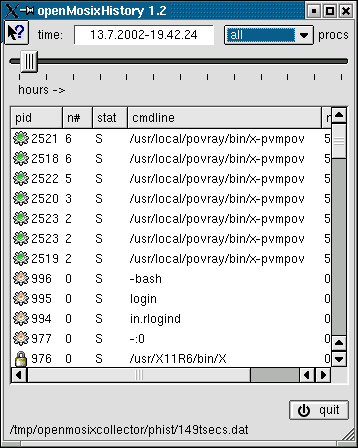
displays the processlist from the past
openMosixhistory gives a detailed overview which process was running on which node. The openMosixcollector saves the processlist from the host the collector was started on and you can browse this log-data with openMosixhistory. You can easy change the browsing time in openMosixhistory by the time-slider.
openMosixhistory can analyze the current "online" logfiles but you can also open older backups of your openMosixcollector history logs by the filemenu.
The logfiles are placed in /tmp/openmosixcollector/* (the backups in /tmp/openmosixcollector[date]/*) and you have to open only the main history file "cluster" to take a look at older load-informations. (the [date] in the backup directories for the log-files is the date the history is saved) The start time is displayed on the top/left and you have a 12 hour view in openMosixhistory.
Hosting by: Hurra Communications Ltd.
Generated: 2007-01-26 17:58:29
